|
Participants | Visitors | Home |
|
|||||||||||||||||||||||
|
|
|||||||||||||||||||||||
| News | ||
| About | ||
| Background
Scientific Data |
||
| Study Sites | ||
| Logistics | ||
| Daily Plan-It | ||
| Activities | ||
| Photos | ||
| Data Archive | ||
| Forecast | ||
| Measurements | ||
| Aircraft | ||
| Participanting Organizations | ||
| Related Links | ||
 |
||
| Forecasts | ||||||||||||||||||||||||||||||||||||||||||||||||||||||||||||||||||||||||||||||||||||||
|
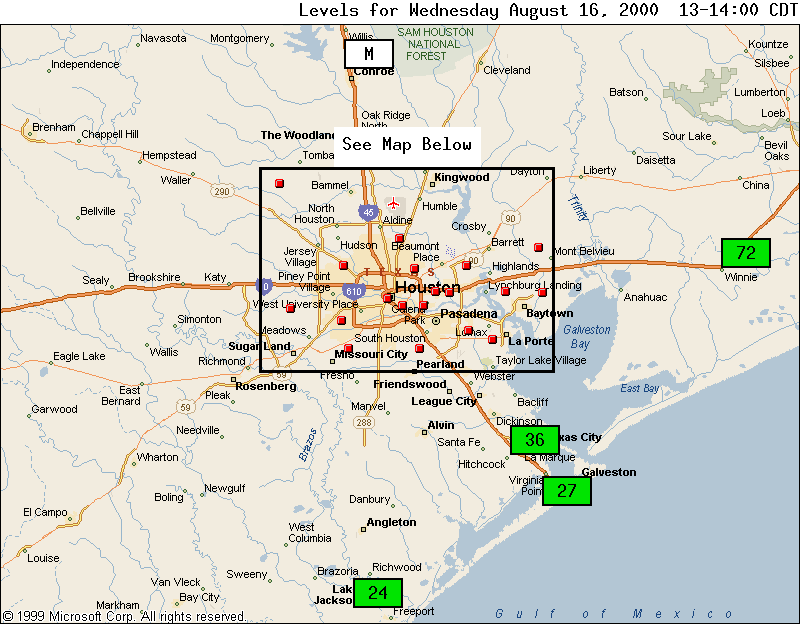
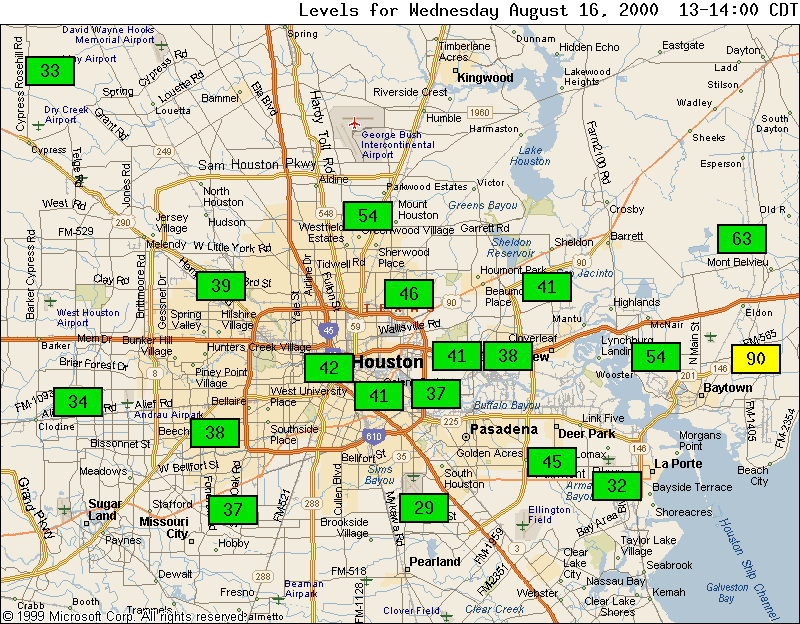
Click here for current forecast. Texas A&M forecast data:http://www.met.tamu.edu/t2k/
|
||||||||||||||||||||||||||||||||||||||||||||||||||||||||||||||||||||||||||||||||||||||
|
ARCHIVE:
|
| |
This site created by the Instructional Media Lab |